
Unified Reporting Platform
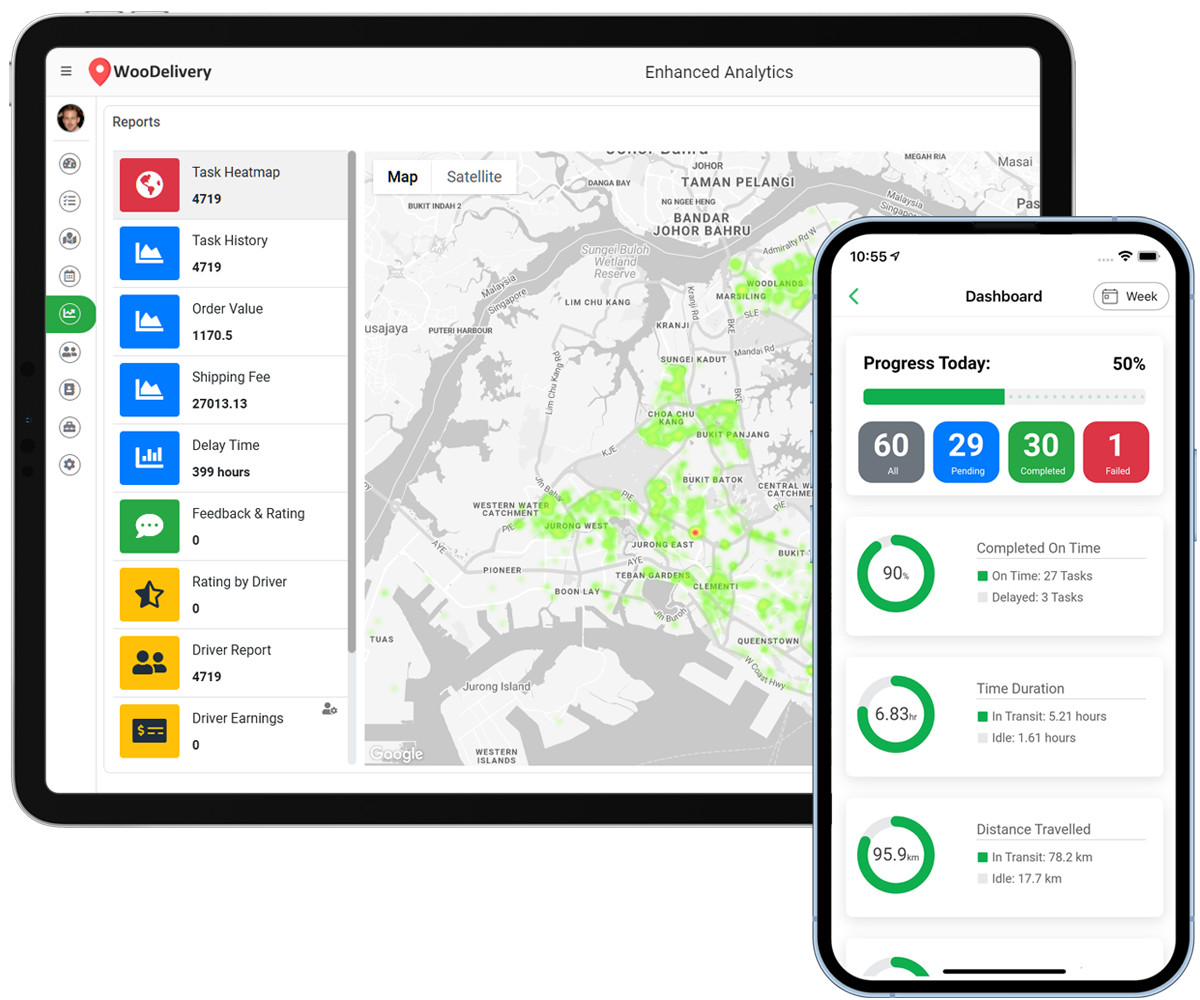
Dashboard Analytics
It allows organization administrators and dispatchers to view historical task and driver data in actionable graphics.Task analytics are broken up into some key metrics such as completion rate (succeeded or failed), delay time and service time.
- Heatmap Report
- Metrics Tracking
- Earnings Report
- Agents reports
- Routes Analysis
- Delay Analysis
- Feedback & Rating
- Demand Gap
We are building a
AI Powered Solution for
AI Powered Solution for
Hyperlocal Analytics
This new module provides fastest way for decision makers to analyze the health of hyperlocal delivery business on ground.
Profiling Routes & Trips
Which routes are profitable or delayed?
Supply & Demand Gap
Where are there gaps in your allocation?
Monitor & Analyze KPIs
Where & when do customers place orders?
Historical Data Analysis
What are the findings when go back to debug?
